2.3. First Visualizations: Scatter Plots and Histograms#
Below you can find the animated GIF for the ball-drop histogram and the flaschards for Section 2.3 of Foundations of Data Science with Python
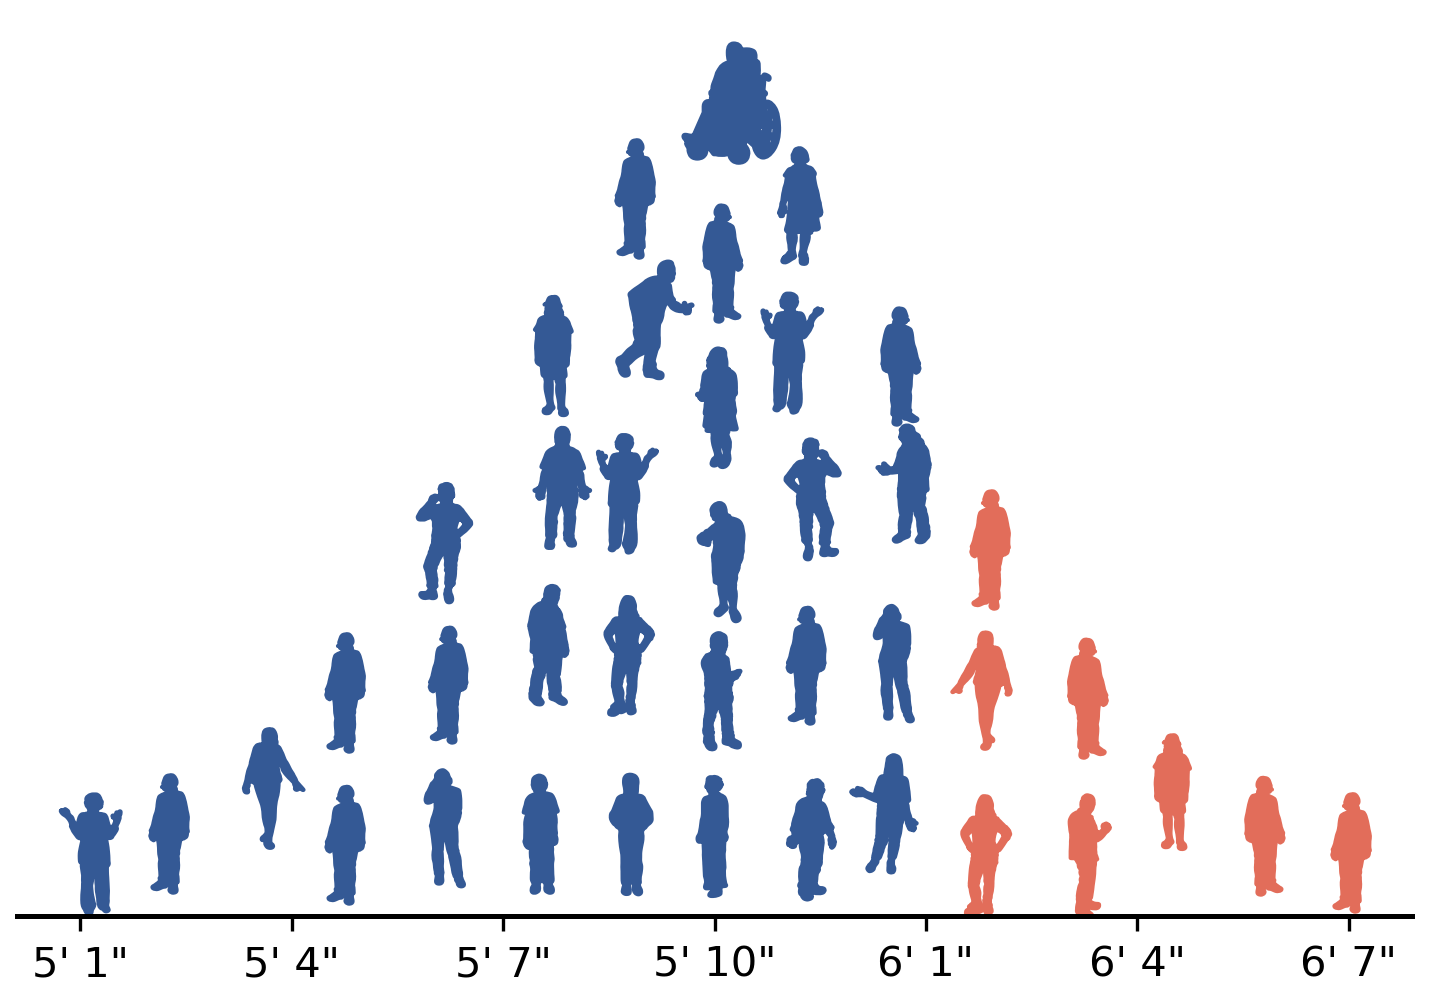
2.3.1. Ball-Drop Histogram#
(See the code to generate this in the Jupyter Notebook to Generate Ball Drop Graph).
Self-Assessment:
The following questions can be used to check your understanding of the material covered in this chapter: